走进 vLLM(五):benchmark 与 auto-tuning —— latency 与 throughput 之争
为什么延迟和吞吐天生互相拉扯?TTFT、ITL、TPOT、E2E、Goodput 到底各测的是什么?roofline 模型怎么解释「算 1 个 token 和算 10 个 token 差不多快」?以及 vLLM 自带的 vllm bench 三个脚本分别在什么场景下用。
本篇属于系列 走进 vLLM:高吞吐 LLM 推理系统解剖 · 第 5 篇
原文:Inside vLLM: Anatomy of a High-Throughput LLM Inference System,作者 Aleksa Gordic,2025-09-05 发布于 vLLM 官方博客。
本文是系列《走进 vLLM:高吞吐 LLM 推理系统解剖》的第 5 篇,共 5 篇。承接第 4 篇(从单卡到多机)。
本站中英对照排版:左栏英文原文,右栏中文译文;不好翻译的术语保留英文写法。
Benchmarks and auto-tuning - latency vs throughput
Benchmarks and auto-tuning —— latency vs throughput
So far we’ve been analyzing the “gas particles” — the internals of how requests flow through the engine/system. Now it’s time to zoom out and look at the system as a whole, and ask: how do we measure the performance of an inference system?
到目前为止,我们一直在分析“气体分子”——请求是如何在 engine / 系统内部流动的。现在该把镜头拉远,看整个系统,并问一句:我们到底怎么衡量一个推理系统的性能?
At the highest level there are two competing metrics:
最高层面上,有两个互相竞争的核心指标:
- Latency — the time from when a request is submitted until tokens are returned
- Throughput — the number of tokens/requests per second the system can generate/process
- Latency(延迟) —— 从请求提交到 token 返回所花的时间
- Throughput(吞吐) —— 系统每秒能生成/处理的 token 数或请求数
Latency matters most for interactive applications, where users are waiting on responses.
Latency 对交互式应用最重要,因为用户正等着响应。
Throughput matters in offline workloads like synthetic data generation for pre/post-training runs, data cleaning/processing, and in general - any type of offline batch inference jobs.
Throughput 在离线工作负载里最重要,比如为训练前/后阶段做合成数据生成、数据清洗与处理,以及任何形式的离线批量推理任务。
Before explaining why latency and throughput compete, let’s define a few common inference metrics:
在解释为什么延迟和吞吐会互相拉扯之前,先定义几个常见的推理指标:
| Metric | Definition |
|---|---|
TTFT(time to first token) |
Time from request submission until the first output token is received |
ITL(inter-token latency) |
Time between two consecutive tokens (e.g., from token i-1 to token i) |
TPOT(time per output token) |
The average ITL across all output tokens in a request |
Latency / E2E(end-to-end latency) |
Total time to process a request, i.e. TTFT + sum of all ITLs, or equivalently the time between submitting request and receiving the last output token |
Throughput |
Total tokens processed per second (input, output, or both), or alternatively requests per second |
Goodput |
Throughput that meets service-level objectives (SLOs) such as max TTFT, TPOT, or e2e latency. For example, only tokens from requests meeting those SLOs are counted |
| 指标 | 定义 |
|---|---|
TTFT(time to first token) |
从请求提交到收到第一个输出 token 的时间 |
ITL(inter-token latency) |
两个连续 token 之间的时间(比如从 token i-1 到 token i) |
TPOT(time per output token) |
一个请求里所有输出 token 的 ITL 平均值 |
Latency / E2E(end-to-end latency) |
处理一个请求的总时间,即 TTFT + 所有 ITL 之和;等价于从提交请求到收到最后一个输出 token 的时间 |
Throughput |
每秒处理的 token 总数(输入、输出或两者),或者每秒请求数 |
Goodput |
满足服务等级目标(SLO,比如最大 TTFT、TPOT 或 e2e 延迟)的那部分吞吐。举例来说,只有来自满足这些 SLO 的请求的 token 才被计入 |
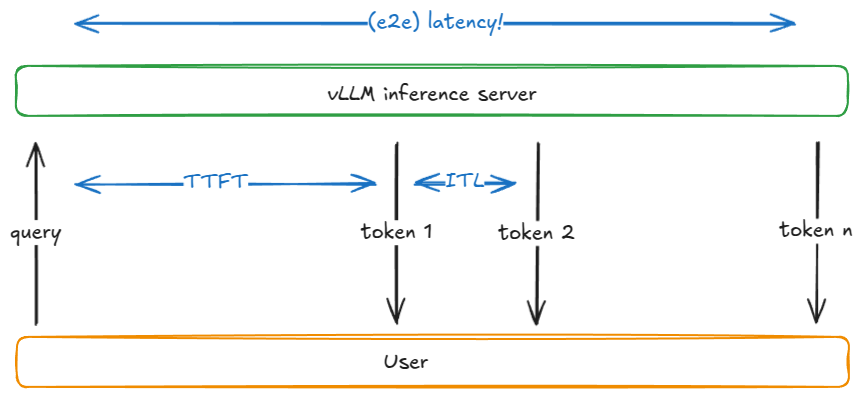
Figure 16: ttft, itl, e2e latency
Here is a simplified model explaining the competing nature of these 2 metrics.
下面用一个简化模型来解释这两个指标为什么互相竞争。
Assumption:
weight i/o and not KV cache i/o dominates; i.e. we’re dealing with short sequences.
假设
权重 I/O 而非 KV cache I/O 占主导;也就是说,我们处理的是短序列。
The tradeoff becomes clear when looking at how batch size B affects a single decode step. As B ↓ toward 1, ITL drops: there’s less work per step and the token isn’t “competing” with others. As B ↑ toward infinity, ITL rises because we do more FLOPs per step—but throughput improves (until we hit peak perf) because weight I/O is amortized across more tokens.
看 batch size B 如何影响单个 decode step,这个权衡就清楚了。当 B ↓ 趋近 1 时,ITL 下降:每一步的工作更少,这个 token 也不用跟别人“抢”。当 B ↑ 趋近无穷时,ITL 上升,因为每一步要做的 FLOPs 更多——但吞吐改善了(直到撞上峰值性能),因为权重 I/O 被摊薄到更多 token 上。
A roofline model helps with understanding here: below a saturation batch B_sat, the step time is dominated by HBM bandwidth (streaming weights layer-by-layer into on-chip memory), so step latency is nearly flat—computing 1 vs 10 tokens can take a similar time. Beyond B_sat, the kernels become compute-bound and step time grows roughly with B; each extra token adds to ITL.
roofline 模型能帮助理解这里:在饱和 batch size B_sat 之下,step 时间由 HBM 带宽主导(一层层把权重流进片上内存),所以 step 延迟几乎是平的——算 1 个 token 和算 10 个 token 可能花差不多的时间。超过 B_sat 之后,kernel 变成 compute-bound,step 时间大致随 B 增长;每多一个 token 都会推高 ITL。
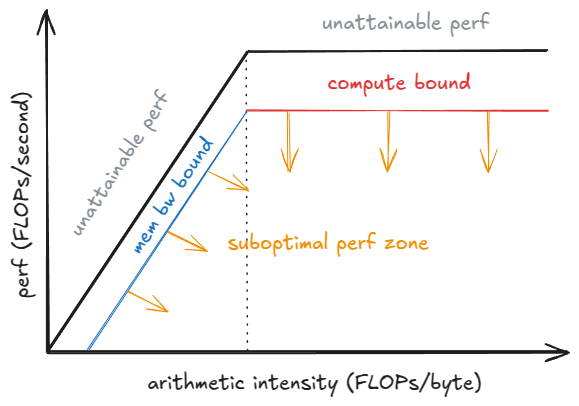
Figure 17: roofline perf model
Note:
For a more rigorous treatment, we have to account for kernel auto-tuning: as
Bgrows, the runtime may switch to more efficient kernels for that shape, changing the achieved performanceP_kernel. Step latency ist = FLOPs_step / P_kernel, whereFLOPs_stepis the work in the step. You can see that asP_kernelhitsP_peakmore compute per step will directly lead to an increase in latency.
注解
更严谨地讲,还要考虑 kernel auto-tuning:随着
B增大,运行时可能切换到对这种 shape 更高效的 kernel,从而改变实际达到的性能P_kernel。step 延迟是t = FLOPs_step / P_kernel,其中FLOPs_step是这一步的工作量。你可以看到,当P_kernel逼近P_peak时,每步更多的计算量会直接导致延迟上升。
How to benchmark in vLLM
How to benchmark in vLLM
vLLM provides a vllm bench {serve,latency,throughput} CLI that wraps vllm / benchmarks / {server,latency,throughput}.py.
vLLM 提供 vllm bench {serve,latency,throughput} CLI,它封装了 vllm/benchmarks/{server,latency,throughput}.py。
Here is what the scripts do:
这几个脚本分别做什么:
- latency — uses a short input (default 32 tokens) and samples 128 output tokens with a small batch (default 8). It runs several iterations and reports e2e latency for the batch.
- throughput — submits a fixed set of prompts (default: 1000 ShareGPT samples) all at once (aka as
QPS=Infmode), and reports input/output/total tokens and requests per second across the run. - serve — Launches a vLLM server and simulates a real-world workload by sampling request inter-arrival times from a Poisson (or more generally, Gamma) distribution. It sends requests over a time window, measures all the metrics we’ve discussed, and can optionally enforce a server-side max concurrency (via a semaphore, e.g. limiting the server to 64 concurrent requests).
- latency —— 用较短的输入(默认 32 个 token),以较小的 batch(默认 8)采样 128 个输出 token。它会跑若干次迭代,并报告该 batch 的 e2e 延迟。
- throughput —— 一次性提交一组固定的 prompt(默认 1000 条 ShareGPT 样本)(也就是所谓的
QPS=Inf模式),报告整轮运行的输入/输出/总 token 数,以及每秒请求数。 - serve —— 启动一个 vLLM server,并从 Poisson(更一般地说是 Gamma)分布采样请求的到达间隔时间,来模拟真实负载。它在一段时间窗口内发送请求,测量我们讨论过的所有指标,并且可以选择在 server 端强制最大并发(通过信号量,比如把 server 限制在 64 个并发请求)。
Here is an example of how you can run the latency script:
下面是一个运行 latency 脚本的例子:
vllm bench latency
  --model <model-name>
  --input-tokens 32
  --output-tokens 128
  --batch-size 8
说明
Benchmark configs used in CI live under
.buildkite/nightly-benchmarks/tests.
说明
CI 里用的 benchmark 配置在
.buildkite/nightly-benchmarks/tests下。
There is also an auto-tune script that drives the serve benchmark to find argument settings that meet target SLOs (e.g., “maximize throughput while keeping p99 e2e < 500 ms”), returning a suggested config.
另外还有一个 auto-tune 脚本,它会驱动 serve benchmark 去寻找满足目标 SLO 的参数设置(比如“在保持 p99 e2e < 500 ms 的前提下最大化吞吐”),并返回一个建议配置。
Epilogue
Epilogue(尾声)
We began with the basic engine core (UniprocExecutor), added advanced features like speculative decoding and prefix caching, scaled up to MultiProcExecutor (with TP/PP > 1), and finally scaled out, wrapped everything in the asynchronous engine and distributed serving stack—closing with how to measure system performance.
我们从基础的 engine core(UniprocExecutor)开始,加上了 speculative decoding、prefix caching 这些高级特性,横向扩容到 MultiProcExecutor(TP/PP > 1),最后横向扩展,把所有东西包进异步 engine 和分布式服务栈——并以如何度量系统性能收尾。
vLLM also includes specialized handling that I’ve skipped. E.g.:
vLLM 里还有一些我跳过的专门处理,比如:
- Diverse hardware backends: TPUs, AWS Neuron (Trainium/Inferentia), etc.
- Architectures/techniques:
MLA,MoE, encoder-decoder (e.g., Whisper), pooling/embedding models,EPLB,m-RoPE,LoRA,ALiBi, attention-free variants, sliding-window attention, multimodal LMs, and state-space models (e.g., Mamba/Mamba-2, Jamba) - TP/PP/SP
- Hybrid KV-cache logic (Jenga), more complex sampling methods like beam sampling, and more
- Experimental: async scheduling
- 多样的硬件后端:TPU、AWS Neuron(Trainium/Inferentia)等
- 架构/技术:
MLA、MoE、encoder-decoder(比如 Whisper)、pooling/embedding 模型、EPLB、m-RoPE、LoRA、ALiBi、无 attention 变体、sliding-window attention、多模态 LM,以及状态空间模型(比如 Mamba/Mamba-2、Jamba) - TP/PP/SP
- Hybrid KV-cache 逻辑(Jenga)、beam sampling 这类更复杂的采样方法,等等
- 实验性功能:async scheduling
The nice thing is that most of these are orthogonal to the main flow described above—you can almost treat them like “plugins” (in practice there’s some coupling, of course).
好消息是,它们中的大多数和上面讲的主流程是正交的——你几乎可以把它们当作“插件”(当然实践里还是有些耦合)。
I love understanding systems. Having said that, the resolution definitely suffered at this altitude. In the next posts I’ll zoom in on specific subsystems and get into the nitty-gritty details.
我热爱理解系统。话虽如此,在这个高度上,分辨率确实牺牲了不少。接下来的文章里,我会逐个拉近具体子系统,抠到细节里去。
Get in touch:
If you spot any errors in the post, please DM me - feel free to drop me a message on X or LinkedIn or via anon feedback.
Acknowledgments
Acknowledgments(致谢)
A huge thank you to Hyperstack for providing me with H100s for my experiments over the past year!
非常感谢 Hyperstack 在过去一年里为我的实验提供 H100!
Thanks to Nick Hill (core vLLM contributor, RedHat), Kaichao You (core vLLM contributor), Mark Saroufim (PyTorch), Kyle Krannen (NVIDIA, Dynamo), and Ashish Vaswani for reading pre-release version of this blog post and providing feedback!
感谢 Nick Hill(vLLM 核心贡献者,RedHat)、Kaichao You(vLLM 核心贡献者)、Mark Saroufim(PyTorch)、Kyle Krannen(NVIDIA, Dynamo)和 Ashish Vaswani 阅读本文发布前的版本并提供反馈!
References
- vLLM https://github.com/vllm-project/vllm
- “Attention Is All You Need” https://arxiv.org/abs/1706.03762
- “Efficient Memory Management for Large Language Model Serving with PagedAttention” https://arxiv.org/abs/2309.06180
- “DeepSeek-V2: A Strong, Economical, and Efficient Mixture-of-Experts Language Model” https://arxiv.org/abs/2405.04434
- “Jenga: Effective Memory Management for Serving LLM with Heterogeneity” https://arxiv.org/abs/2503.18292
- “Orca: A Distributed Serving System for Transformer-Based Generative Models” https://www.usenix.org/conference/osdi22/presentation/yu
- “XGrammar: Flexible and Efficient Structured Generation Engine for Large Language Models” https://arxiv.org/abs/2411.15100
- “Accelerating Large Language Model Decoding with Speculative Sampling” https://arxiv.org/abs/2302.01318
- “EAGLE: Speculative Sampling Requires Rethinking Feature Uncertainty” https://arxiv.org/abs/2401.15077
- “Medusa: Simple LLM Inference Acceleration Framework with Multiple Decoding Heads” https://arxiv.org/abs/2401.10774
注释
- vLLM —— https://github.com/vllm-project/vllm
- “Attention Is All You Need” —— https://arxiv.org/abs/1706.03762
- “Efficient Memory Management for Large Language Model Serving with PagedAttention” —— https://arxiv.org/abs/2309.06180
- “DeepSeek-V2: A Strong, Economical, and Efficient Mixture-of-Experts Language Model” —— https://arxiv.org/abs/2405.04434
- “Jenga: Effective Memory Management for Serving LLM with Heterogeneity” —— https://arxiv.org/abs/2503.18292
- “Orca: A Distributed Serving System for Transformer-Based Generative Models” —— https://www.usenix.org/conference/osdi22/presentation/yu
- “XGrammar: Flexible and Efficient Structured Generation Engine for Large Language Models” —— https://arxiv.org/abs/2411.15100
- “Accelerating Large Language Model Decoding with Speculative Sampling” —— https://arxiv.org/abs/2302.01318
- “EAGLE: Speculative Sampling Requires Rethinking Feature Uncertainty” —— https://arxiv.org/abs/2401.15077
- “Medusa: Simple LLM Inference Acceleration Framework with Multiple Decoding Heads” —— https://arxiv.org/abs/2401.10774
- LMCache —— https://github.com/LMCache/LMCache
讨论
这里是静态站点,没有内嵌评论区。如果这篇文章对你有用,欢迎通过 RSS 订阅后续更新。